Introduction
In today’s competitive business environment, every decision depends on accurate and timely information. Modern organizations generate large volumes of data through daily ERP Sofware transactions such as leads, enquiries, quotations, sales orders, work orders, dispatch plans, invoices, production entries, purchase orders, quality inspections, finance records, and stock movements.
However, data alone does not create business value. Real value comes from converting data into clear insights, meaningful summaries, visual trends, and actionable reports.
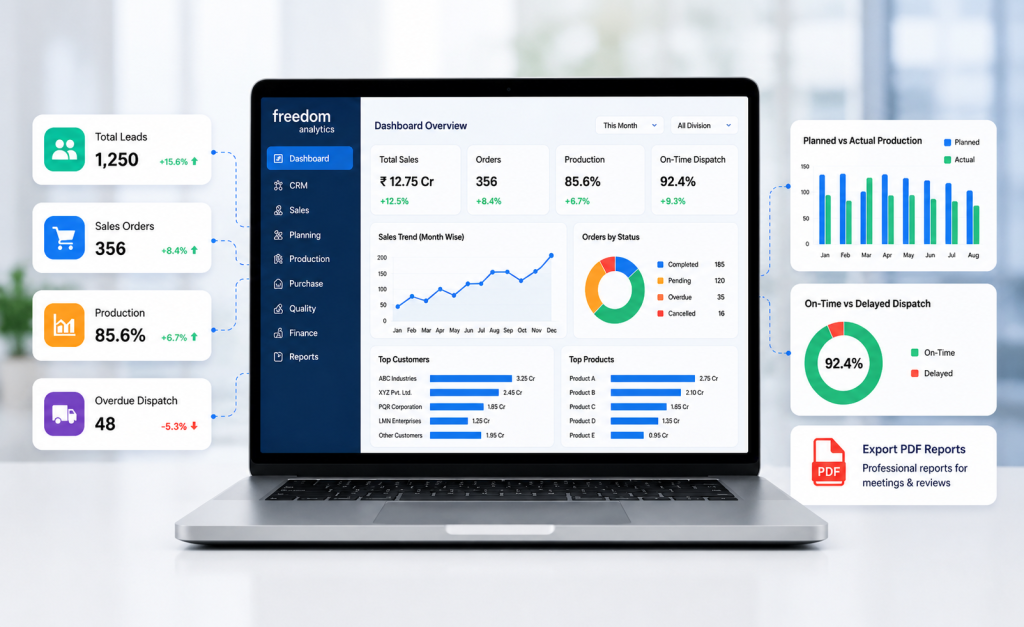
Freedom Analytics is designed to transform ERP data into smart business intelligence. It converts day-to-day transactions into interactive KPI cards, charts, drill-down reports, trend analysis, and management-ready PDF outputs.
With Freedom Analytics, business performance becomes easier to monitor, understand, and improve.
What is Freedom Analytics?
Freedom Analytics is an interactive analytics and reporting solution designed to provide clear visibility into ERP data. It transforms complex business transactions into simple dashboards that support faster and more informed decision-making.
Instead of relying on multiple reports, manual verification, and repeated Excel exports, Freedom Analytics presents important business information in a structured and visual format.
It delivers insights through:
- KPI cards
- Interactive charts
- Drill-down reports
- Module-wise dashboards
- Trend analysis
- Pending and overdue tracking
- Planned vs actual comparisons
- Customer and product analysis
- PDF reports for business reviews
Freedom Analytics acts as a business intelligence layer over ERP data.
Why Freedom Analytics is Important
ERP systems store valuable business information. However, when information is spread across multiple screens and reports, analysis becomes time-consuming.
Management teams and department heads often need quick answers to questions such as:
- What is the current sales performance?
- How many orders are pending?
- Which dispatches are delayed?
- What is the production completion percentage?
- Which customers contribute the most business?
- Which products move faster?
- Which work orders are overdue?
- Which department requires immediate attention?
Freedom Analytics answers these questions through a single interactive dashboard.
It reduces manual report verification and improves visibility across departments.
Interactive KPI Cards for Instant Business Summaries
KPI cards are one of the key features of Freedom Analytics. They display important business metrics in a simple and direct format.
Examples of KPI cards include:
- Total Leads
- Pending Enquiries
- Quotation Value
- Sales Order Count
- Sales Order Value
- Pending Work Orders
- Completed Production Quantity
- Overdue Dispatch Plans
- Invoice Value
- Top Customer
- Top Product
- Rejection Percentage
- Machine Utilization Percentage
Each KPI card provides a quick business summary. With drill-down support, users can also view the detailed records behind each KPI.
For example, if a KPI card displays Pending Work Orders, the drill-down report can show the related work order number, customer, item, quantity, due date, pending quantity, and status.
This creates a clear connection between summary values and actual ERP records.
Charts that Simplify Business Analysis
Freedom Analytics uses interactive charts to present data visually. Charts make it easier to identify trends, compare performance, and detect delays.
Common chart types include:
- Month-wise performance charts
- Status-wise summary charts
- Pending vs completed charts
- Planned vs actual quantity charts
- Customer-wise analysis charts
- Product-wise analysis charts
- Division-wise performance charts
- Ageing analysis charts
- On-time vs delayed activity charts
Visual dashboards simplify complex ERP data. Instead of reading lengthy reports, business users can quickly understand performance through structured charts and summaries.
Drill-Down Reports for Detailed Verification
An effective analytics dashboard should not stop with summary numbers. Every summary should be supported by detailed transaction records.
Freedom Analytics provides drill-down reports for KPI cards and charts, helping users verify the data behind each number.
Example: Overdue Dispatch Plans – 48
The drill-down report can display:
- Customer name
- Product name
- Planned dispatch date
- Pending quantity
- Current status
- Responsible person
- Delay duration
This improves transparency and helps identify transactions that require immediate attention.
Module-Wise Business Analytics
Freedom Analytics supports analytics across multiple ERP modules.
| Module | Analytics Coverage |
|---|---|
| CRM | Leads, enquiries, quotations, follow-ups, and conversion analysis |
| Sales | Sales orders, dispatches, invoices, customer performance, and product performance |
| Planning | Work orders, dispatch plans, and daily production plans |
| Production | Output, rejection, rework, machine performance, and process performance |
| Purchase | Purchase orders, supplier performance, and pending materials |
| Stores | Stock movement, inventory status, and material availability |
| Quality | Inspection, rejection, rework, and quality trends |
| Finance | Outstanding balances, receivables, payables, and collections |
This creates a connected business performance view across the organization.
Saved Views and Smart Filters
Freedom Analytics supports flexible filters for focused analysis.
Common filters include:
- Period
- Date range
- Division
- Customer
- Product
- Status
- Executive
- Region
- Order type
Users can save preferred KPI cards, filters, and report layouts. This helps maintain consistent dashboard views for different departments and user roles.
PDF Reports for Management Reviews
Freedom Analytics supports professional PDF exports for business reviews and reporting.
PDF reports can include:
- KPI cards
- Charts
- Filter summaries
- Drill-down details
- Department-wise summaries
- Management-ready formatting
These reports are useful for monthly reviews, production meetings, sales discussions, dispatch planning, customer reviews, and management presentations.
Key Benefits of Freedom Analytics
| Benefit | Business Value |
|---|---|
| Faster Decision-Making | Important business data is available in a single dashboard |
| Better Visibility | Department-wise performance becomes easier to monitor |
| Clear Accountability | Drill-down reports show exact transaction details |
| Improved Follow-Up | Pending, overdue, and delayed records are highlighted |
| Better Planning Control | Planned vs actual performance can be tracked |
| Reduced Manual Reporting | Less dependency on repeated report verification and Excel exports |
| Stronger Management Reviews | PDF outputs support structured review meetings |
| Data-Driven Operations | ERP data becomes practical business intelligence |
Conclusion
ERP data becomes truly valuable only when it is transformed into clear and actionable insights.
Freedom Analytics converts daily ERP transactions into meaningful business intelligence through KPI cards, interactive charts, drill-down reports, saved views, and PDF outputs.
From CRM to sales, planning to production, and dispatch to finance, Freedom Analytics brings important business information into one structured and visual platform.
It supports better visibility, faster decision-making, stronger follow-up, and improved business control.
Freedom Analytics — Clear Data. Smart Insights. Better Decisions.